In the Home of the Free, Why Are So Many People in Prison?
The high rate of incarceration in the United States is fraught with social and economic costs. Relatively recent increases in our incarceration rate make us an international outlier and carry a price tag of more than $80 billion annually (more than quadruple the 1980 corrections expenditures). This is despite an overall reduction in crime rates between 1990 and 2012.
In addition to the overall incarceration rate, there is a staggering gap between the incarceration rates of black Americans and white Americans. The gap is most clearly seen between black and white males. Based on 2001 incarceration rates, nearly 1 in 3 (32.2%) black males will will be sentenced to prison during their lifetimes, whereas the rate for white males is 5.9%.
Topic 5 in Fair Game? asked users to think about how much greater the rate of imprisonment is for black versus white men in the US and how much greater it should be in a fair world.
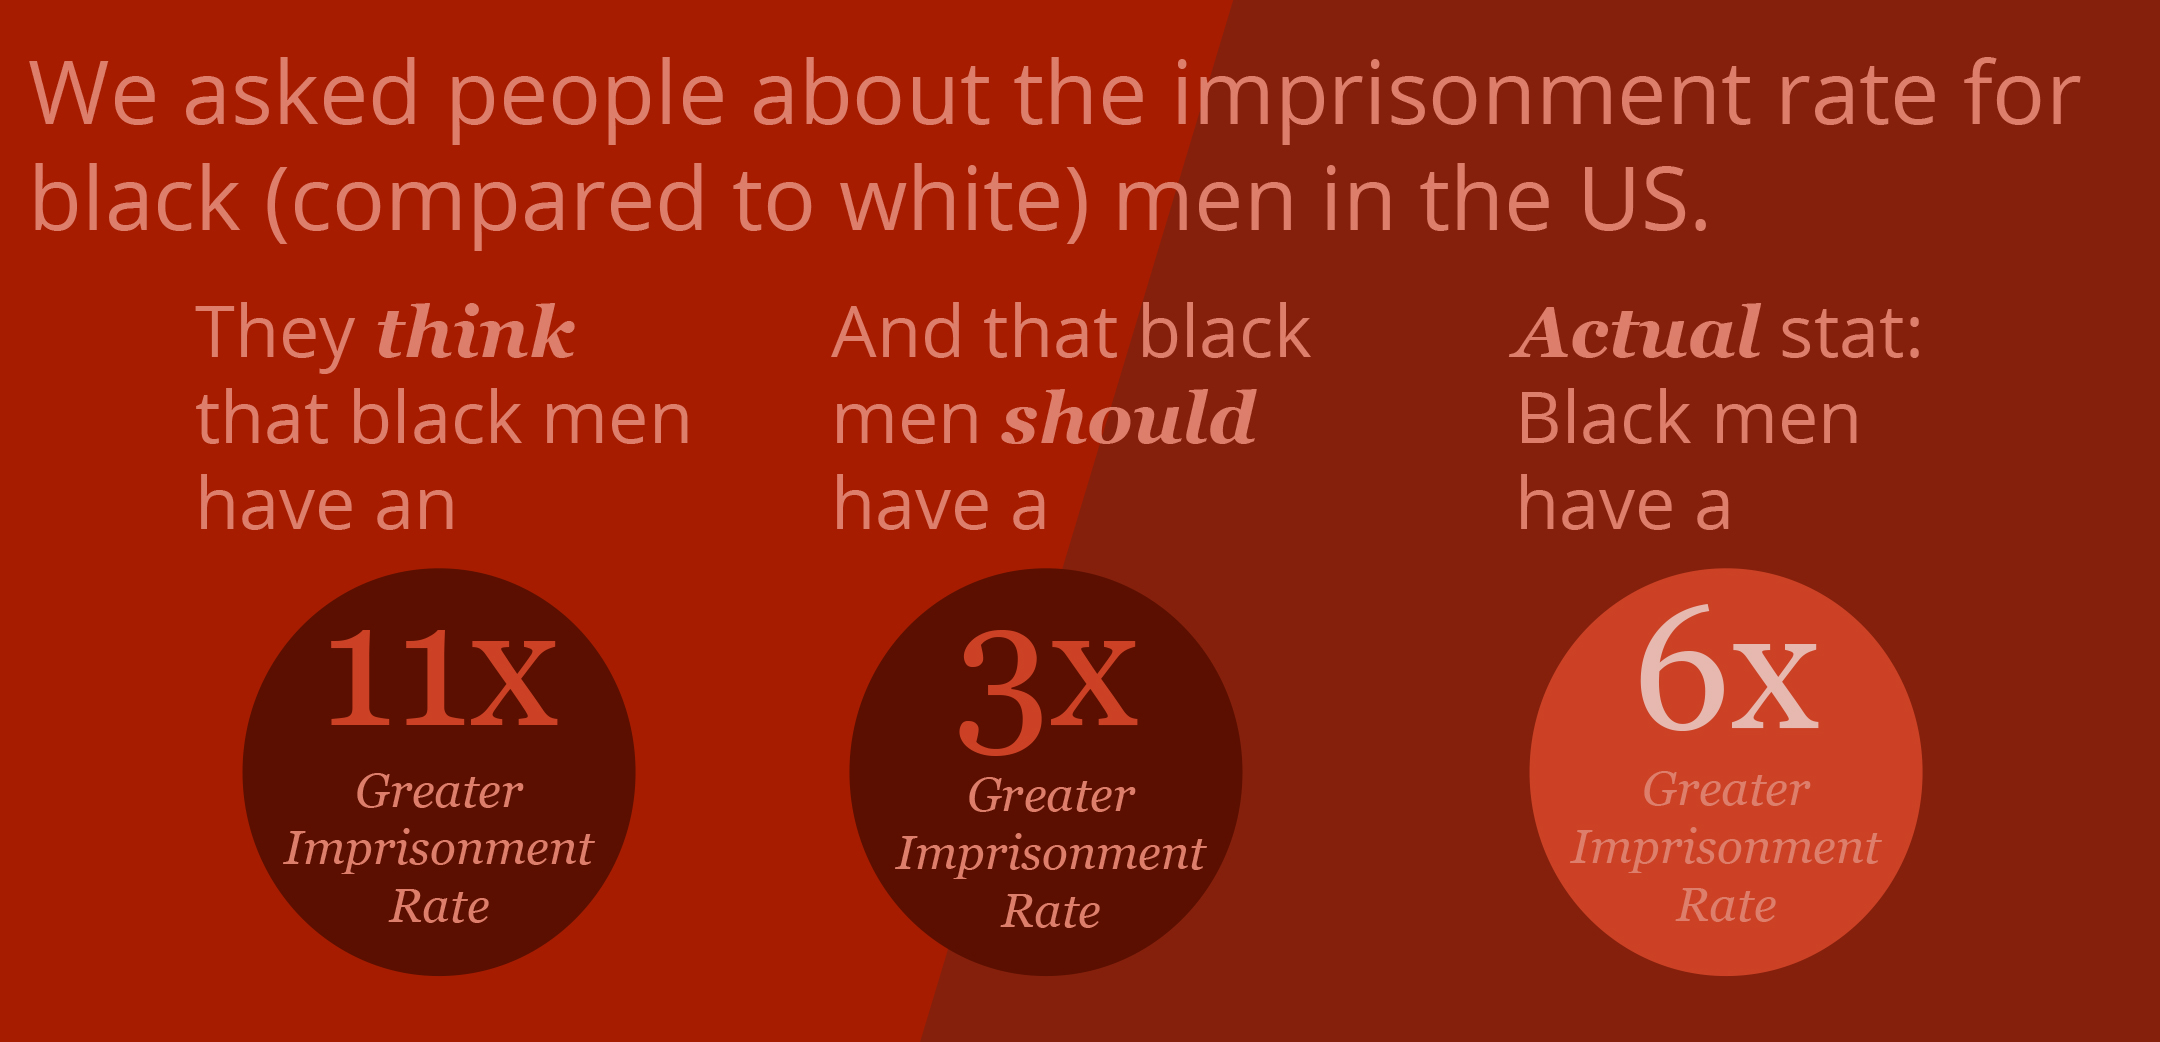
On the whole, our users estimated that black males have an 11x greater imprisonment rate than white males. In reality, recent data shows the imprisonment rate is 6x greater.
How much more greater do people think the imprisonment rate should be in a fair world? 3x more likely.
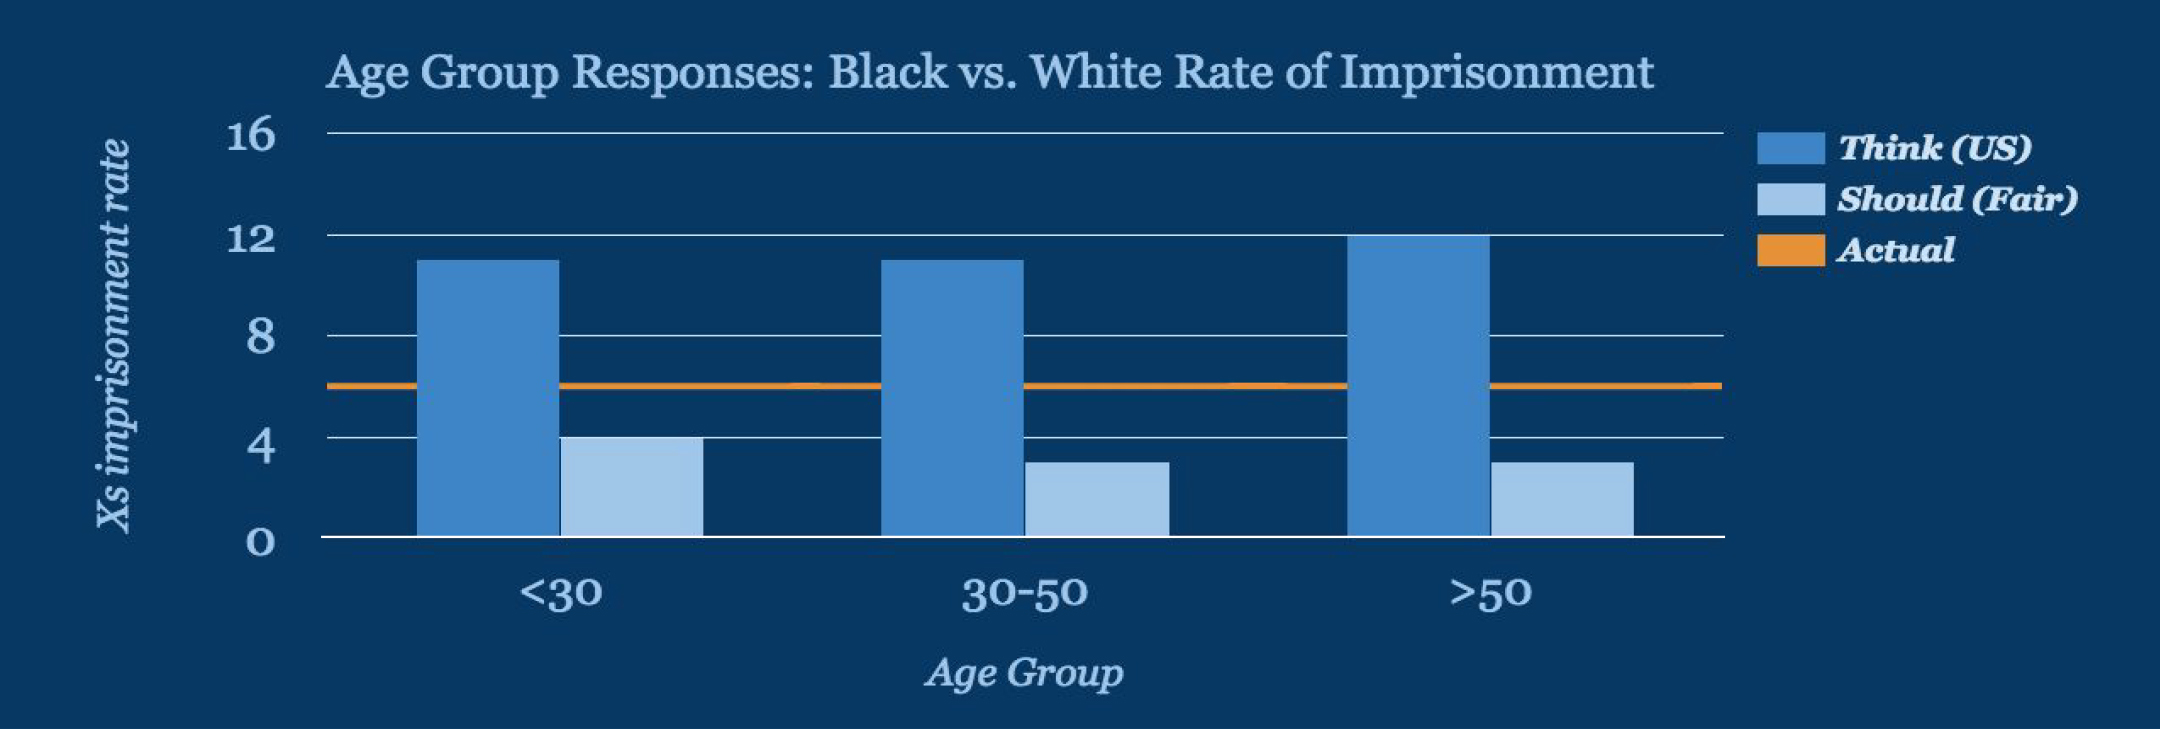
Estimates for the greater likelihood of imprisonment were remarkably similar across all age groups, as were our users’ beliefs about what would be fair.
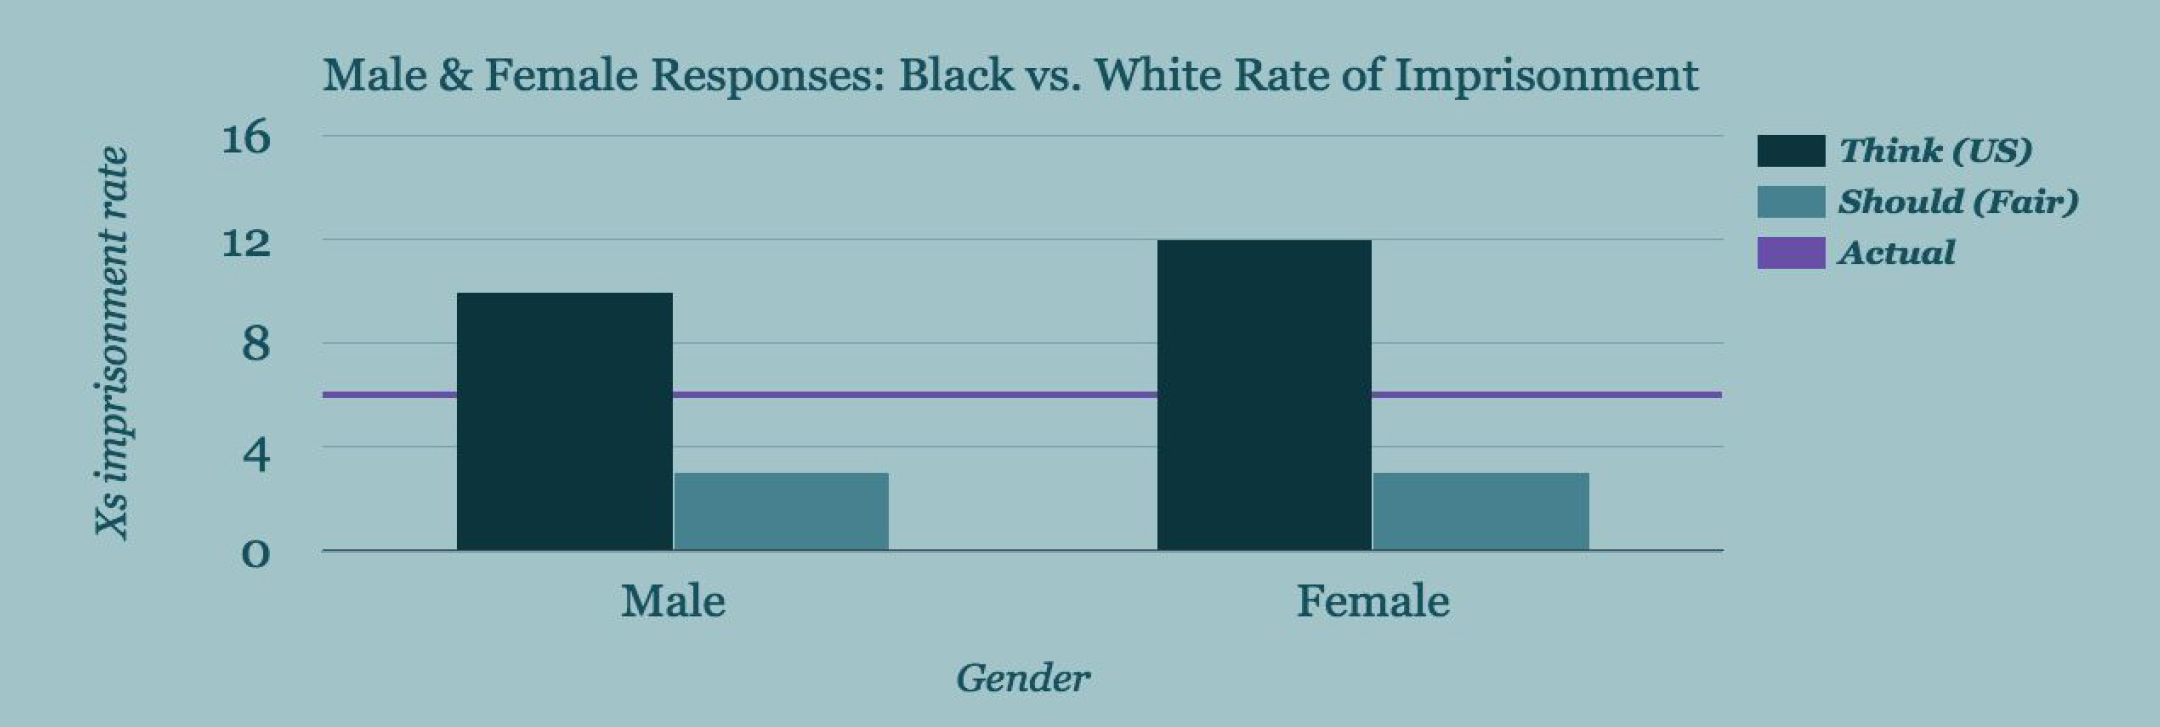
What about gender? Males and females differ in their estimates of the greater rate of imprisonment, estimating 10 and 12 times greater likelihoods, respectively. But they agree in what they think a fair rate would be — 3x.
And political leaning? People who identify as conservative and those who identify as liberal estimate the same (11x) greater rate of imprisonment. In terms of how much greater the rate should be in a fair society, conservatives answered 5x more likely and liberals answered 2x more likely. So although their understanding of the world is similar, their notions of fairness, for this topic, are very different.
Together, the data reported here suggest that people overestimate the gap in the incarceration rate by race. And they would reduce the size of the gap that they perceive. There are many factors that contribute to the racial disparity in imprisonment rate. The so-called War on Drugs may be the single largest factor, with Blacks and Hispanics disproportionately representing those in state prisons for drug offenses and sentenced for federal drug trafficking offenses. These offenses often carry harsh mandatory sentences, further exacerbating the disparities. Discrimination has been shown to be a problem at multiple levels of the criminal justice system, including law enforcement, prosecution, sentencing, and reentry to society.
Beyond the pervasive problem of racial discrimination, another consideration is more purely economic– the growth of private companies building and running prisons. Oliver Hart (a 2016 Nobel prize-winner in Economics) and his coauthors have written about private prison contracts and their tendency to induce the wrong incentives by not focusing on outcomes.
There are economic benefits to reducing the prison population, including reduced costs for taxpayers (construction, maintenance and operation of prisons) and of course income and opportunities for those who would otherwise have been imprisoned. Several states have drug decriminalization ballot initiatives in this year’s election and it will be interesting to see whether these have an impact on the rate of imprisonment in those states. What other possibilities might decrease the prison population and reduce the racial disparity in the rate of imprisonment?
Please join us and play along by downloading Fair Game? from iTunes or Google Play.
 Tweet
Tweet  Like
Like Higher Education, Higher Incomes…Opportunity for all?
Having a college degree can dramatically increase a young adult’s income. According to the National Center for Education Statistics, in 2014 the median earnings of young adults (ages 25-34) with a bachelor’s degree were 66 percent higher ($49,900) than the median earnings of young adults with only high school diplomas ($30,000).
Anyone who performs well in high school can apply to college, and there are many scholarships, financial aid, and other support programs available to help make college an option for everyone. But does this help?
Topic 4 in Fair Game? asked users to think about whether household income is related to the likelihood of getting a college degree and what that relationship should look like in a fair world.
On the whole, our users estimated that the wealthiest 25% of society would be 13x more likely to get a college degree than the poorest 25%. In reality, the wealthiest 25% are about 6x more likely to get a college degree.*
How much more likely do people think the wealthy should be to get a college degree, in a fair world? 4x more likely.
Estimates for the greater likelihood of getting a college degree were remarkably similar across all age groups, as were our users’ beliefs about what would be fair. There may be hints of a difference in what people think is fair, with 30-50 year-olds reporting 4x likelihood, while other age groups said a 5x likelihood would be fair. One possible explanation for this difference is that people in the 30-50 age range may be actively planning or paying for their children’s college expenses.
What about gender? Males and females differ in their estimates of the greater likelihood of getting a college degree for the top 25% of income, estimating 12 and 14 times greater likelihoods, respectively. But they agree in what they think a fair likelihood would be — 4x.
And political leaning? People who identify as conservative and those who identify as liberal estimate the same (13x) greater likelihood of getting a college degree for the wealthy. In terms of how much more likely the top 25% of income should be to get a degree, in a fair society, conservatives answered 6x more likely and liberals answered 3x more likely. So although their understanding of the world is similar, their notions of fairness, for this topic, are very different.
Together, the data reported here suggest that people overestimate the gap in the likelihood of getting a college degree. And they would reduce the size of the gap that they perceive. There are many factors that contribute to the gaps in attainment of a college degree. Family income based factors are certainly an important contributor. But there are also decisions about whether to apply to college at all, what type of college to attend (e.g. for profit vs. nonprofit), how to access and pay back loans, and what kind of support a student may have from their social networks. Sometimes, just the paperwork involved in applying to college can overburden a prospective student and derail the process. It is encouraging then that low-cost interventions have the potential to improve college opportunities for low-income students.
Given the potential economic benefits that would result from more low-income students getting a degree, what are other possibilities that might work to increase the proportion who ultimately do get a degree?
What do you think? Please join us and play along by downloading Fair Game? from iTunes or Google Play.
Life (and the Pursuit of Happiness)– But for How Long?
Confronting our mortality is not an easy task for most people. However, there are many reasons people should consider just how long they might live.
In the case of retirement planning, life expectancy is important in relation to the benefits like Medicare and Social Security that people earn during their working years. According to the Pew Research Center, use of these government benefits programs is “virtually universal (97%) among those ages 65 and older—the age at which most adults qualify for Social Security and Medicare benefits.”
Differences in life expectancy between the rich and the poor can mean that more affluent Americans receive hundreds of thousands of dollars more in benefits that those who are less well off. In addition to the economic considerations, there is a psychological and perhaps even moral factor that comes into play when thinking about how long we might expect to live in relation to our financial status.
Topic 3 in Fair Game? asked users to think about exactly this question and to estimate how income is related to life expectancy and what that relationship should be in a fair world.
“It will surprise nobody to learn that life expectancy increases with income.”— Michael Specter, 4/16/16, The New Yorker
On the whole, our users estimated that the richest 10% of society would have a life expectancy 12 years longer than the poorest 10%. In reality, the difference is 11 years (12 additional years for men and 10.1 additional years for women).
How many more years of life do they think the wealthy should expect in a fair world? 3 more years (a 75% reduction from their estimate of what is true).
Estimates for the current difference in life expectancy were remarkably similar across all age groups, as were our users’ beliefs about what would be fair. Preferences for a fair difference were also similar. There may be hints of a difference between younger and older adults, with a possible explanation simply being ‘mortality salience’, or how much longer users themselves’ expect to live.
What about gender? Both males and females estimate 12 more years of life for the top 10%. But they differ slightly in what they think a fair amount of additional years would be — 4 vs. 3, respectively.
And political leaning? People who identify as conservative and those who identify as liberal only differed by 1 year in terms of what they believed the life expectancy gain from wealth to be, and 2 years in what they thought it should be in a fair world. Conservatives estimate the gain to be 12 years, while liberals put it at 13 years. In terms of what they think would happen in a fair society, conservatives consider 5 years and liberals consider 3 years to be a fair number of years gained with wealth. Despite these small differences, the presumed improvement (from what is thought to what it should be) ends up being 7 years for conservatives vs. 10 years for liberals.
Together, the data reported here suggest that estimations of the present gap in life expectancy are fairly accurate. And that small differences in life expectancy (3-5 years) are considered fair (or perhaps tolerable) by most people. Has the wealth-based life expectancy gap always been this large? According to a Brookings report, it has actually grown from 4.5 years (for the cohort of seniors born in 1920) to 11 years (for the cohort born in 1940). It is likely that multiple factors, including differential access to quality medical care, and higher rates of smoking and obesity, contribute to the growth of this gap. On top of all of this, wealthier people typically retire later and can delay receiving social security payments, thereby increasing income inequality in the older population.
Unfortunately, public benefits that were originally intended to be progressive seem to be becoming (unintentionally) regressive over time. Perhaps there are some solutions that might help to keep more Americans living long, happy, and healthy lives?
What do you think? Please join us and play along by downloading Fair Game? from iTunes or Google Play.
“Equal Pay for Equal Work”
It’s a simple statement but it represents so much more than just four words. For many people, it is a rallying call for closing the gap between men’s and women’s wages, ultimately achieving the goal of pay equity, and protecting a notion of basic fairness.
Others question the very idea of what equal work means, with some people arguing that women make different career choices compared to men and that any gap is merely a reflection of those choices. But in the United States, there are many historical examples of inequality affecting women including: denial of property rights, the right to vote, the ability to obtain higher education, and barriers to particular occupations and specialized careers.

Given the complex history of women’s equality in the U.S., we wanted to find out what people think about the current state of working women and their pay relative to men. We focused on the gender wage gap for topic 2 of Fair Game?, our new app that asks users what they think about the world as it is today and what they would want in a fair world.
Surprisingly, people tend to overestimate the gender wage gap and believe women earn 73% of men’s income. In reality, women are estimated to earn 79% of men’s income.
How much do people think women should be paid in a fair world? 93% of men’s income.
Overall, responses did not dramatically differ by the age of the user.
How does your own gender relate to what you think about this? Male and female users both overestimated the magnitude of the gender wage gap, with men thinking women currently earn 74% of men’s salaries, and women estimating that they earn 70% of men’s salaries.
There was closer agreement for the question of what a fair wage gap should be, with males preferring 93% and females preferring 94% of men’s salaries. On the whole, both genders perceive a gap to exist in the United States and would substantially – but not completely – close that gap in a fair society.
And can we observe differences in views according to political beliefs? People who identify as conservative and those who identify as liberal only differed by 4% in terms of what they believed the gender wage gap to be, and 3% in what they thought it should be in a fair world. Conservatives estimate women’s salaries to be 76% of men’s, while liberals put that percentage at 72%. In terms of what they think would happen in a fair society, conservatives consider 91% and liberals consider 94% to be a fair ratio of women’s to men’s income. Despite these relatively small differences, on average, the increase in women’s salary thought to yield fairness would be 15% for conservatives vs. 22% for liberals.
The gender wage gap is a topic that deserves careful consideration. Although a single number represents an average for all women, the number varies substantially once we consider factors including race, age, education, profession, career trajectory, childbirth status, and U.S. state of residence, to name a few.
There is also likely to be some gender role stereotyping at play in the results we received, with many of our respondents probably assuming that the burden of childcare would or should fall disproportionately on women.
This is a complex topic, but we can learn from some efforts to equalize opportunities in the workplace for women. A program in the Canadian province of Quebec provided an interesting natural experiment, demonstrating that subsidized daycare could support an upsurge in employment of women that in turn boosted economic output to a level that more than paid for the childcare subsidy costs1.
A final consideration is how long it will take to close the gender wage gap, given the progress that has already been made. One measure of improvement (the upward trend since the 1960’s), predicts the gap to close by 2059. But if a recent slowdown in the trend persists, the gap would not close until 2152. What other efforts do you think might be worthwhile to pursue to help close this gap, sooner or later?
And please join us and play along by downloading Fair Game? from iTunes or Google Play.
- Fortin, Pierre et al. (2012). Impact of Quebec’s Universal Low-Fee Childcare Program on Female Labour Force Participation, Domestic Income and Government Budgets. Sherbrooke: Research Chair in Taxation and Public Finance, University of Sherbrooke.
Fair Game? How many average workers’ salaries does it take to pay the CEO?
Inequality is an important topic and one that politicians and scholars spend a lot of time thinking about. But what does the general public think about inequality and the many ways it manifests in daily life? And how do factors like age, gender, or political leanings relate to our views on inequality?
Those are the questions we are exploring with Fair Game?, our new app that asks users what they think about the world as it is today and what they would want in a fair world.
We’re asking users about 13 different topics related to inequality, from wage gaps to opportunities for education, and will be sharing our findings every few days now through mid-November.
Please join us and play along by downloading Fair Game? from iTunes or Google Play. We’ll release a new question every few days until we get through all 13.
You can think about the first topic right now.

So far, the data show a consistent knowledge gap.

Our users estimate that the average CEO’s pay is equal to 151 average worker salaries. In reality, the average CEO makes the same as 303 average workers combined. What do people think CEOs should be paid in a fair world: the same as 72 average employees combined.
We also found some interesting patterns in what people think.
Younger people estimate the ratio of CEO pay to average worker pay to be larger than others do, and also think a larger ratio is fair. Perhaps younger people have lower salaries and therefore think the average worker’s salary is lower? Or they are looking ahead to larger, CEO-like salaries in the future, and that influences what they think is fair?
What about gender?
It is notable that males and females arrive at the same number for what would be fair (72 average worker salaries for each CEO), but differ in what they think currently exists in the world (158 for males vs. 140 for females). Perhaps the gender wage gap influences the perception of what salaries are in the world?
And political leaning?
People who identify as conservative and those who identify as liberal give similar estimates of what the current CEO to average worker salary is (149:1 and 152:1, respectively). But political leaning makes a big difference in what people think what would be fair. Liberal respondents believe 63:1 would be fair, whereas conservative respondents believe that 93:1 would be fair.
It is encouraging that political leaning does not dramatically change our respondents’ perceptions of the world. Both conservatives and liberals underestimate the magnitude of executive pay relative to worker pay in the United States. But their differing assessments of what would be fair suggests that conservatives and liberals might choose different approaches to reducing the executive-to-worker pay ratio.
Executive compensation is by no means a simple issue. In fact, the 2016 Nobel Prize in economics was awarded to researchers who considered how motivational factors should be related to pay, bonuses, stock compensation and the timeframe of company performance in order to achieve optimal levels. One of the winners, Bengt Holmström, told a reporter after hearing he had won, that he thought executive bonuses were “extraordinarily high” and compensation contracts were too complicated.
Has it always been like this? The ratio of executive pay to worker pay was 20-to-1 in 1965, when CEOs earned an average of $832,000 annually, compared to $40,200 for workers (adjusted for today’s dollars). In 2000, the number peaked at 376-to-1, and has since settled back down to the recent level of 303-to-1 (and some estimates are as low as 216-to-1). This increased ratio means that CEO compensation has risen dramatically over the past few decades, but the average worker compensation has not. In 2014 the average CEO made $16,316,000 compared to the $53,200 made by the average worker.
In an effort to promote greater transparency, the Securities and Exchange Commission will soon require every publicly traded company in the United States to disclose this ratio. A recent bill proposed in the California Senate calls for instituting a sliding scale of corporate taxation, with companies paying different tax rates based on their ratios and sharper increases for those with CEO to average worker pay ratios greater than 100-to-1. Other proposals for reducing the ratio and social ramifications of large gaps in companies include greater profit-sharing across employees and a more consistent relationship between (long-term) performance and bonuses.

On Fairness — please join us
What is fair?
According to Merriam-Webster:
: agreeing with what is thought to be right or acceptable
: treating people in a way that does not favor some over others
: not too harsh or critical
Many people can tell you when something is NOT fair (especially children, who test this concept more thoroughly than any scientist could)! Injustice may be an easier phenomenon to spot in the world (especially when we are the victim or perceived victim).
Does society view what is right or acceptable through a single lens, or does an individual’s unique background and experience shape their perception of fairness? In our new app, you can join in by answering questions about aspects of life in the United States. Do you think the world that we live in is fair? What should the world look like? Give your opinions and be a part of this large-scale social expression. You may learn something about yourself and about society. And you’ll help us answer the question, “Is life for everyone in the United States a Fair Game?”
To download for Apple:
https://itunes.apple.com/us/app/fair-game/id1138020713?mt=8
To download for Android/Google:
https://play.google.com/store/apps/details?id=com.advancedhindsight.fairgame
Addressing Inequality with Behavioral Economics
Tomorrow (Tuesday, October 15 from 6-7pm), the Center for Advanced Hindsight will host a discussion on behavioral economics and applications in financial services. We are seeking partnerships with local financial services organizations that are interested in using behavioral-based strategies to help them better serve their mission. The attached Request for Proposals provides a summary of our proposed program. We will also be discussing the RFP on Tuesday and answering questions about the program.
The event is RSVP only. If you are interested in attending, please email rebecca.kelley@duke.edu

Wealth Inequality in Motion.
I recently came across this video that some talented person made of a study I conducted on wealth inequality a few years back with Mike Norton. It does a great job covering the main findings regarding the differences between what Americans think the distribution of wealth is (somewhat even), what they would prefer (more even than socialist Sweden), and how wealth is actually distributed (the bottom 40% of Americans possessing less than 0.3% of total wealth, the top 20% possessing 84%). The graphs, and a longer explanation, are also available here.
The only thing I wish he emphasized a little more is how similar the results were for Democrats and Republicans, which I found very hopeful. Even with all the ideological polarization in Washington, the moment we ask the question of ideal wealth distribution in a general and less self-interested way, we seem to be a country that cares a lot about each other.
I ______ a dollar?
As part of the PoorQuality: Inequality exhibition that is currently on display at the CAH, we are showing a piece of art by Jody Servon entitled “I ______ a dollar.” This piece started out as one hundred $1 bills stuck flat against the wall. The bills hung there in a simple, uniform shape, Washington after Washington. The money was there for the taking, but only if you needed it. Jody asked viewers to think about the value of a single dollar, to contemplate their “needs” in relation to their “wants.”

“My hope is for people to actively consider whether or not having this single dollar will make a difference in his or her life, or if they feel the dollar is better left for someone else who needs it more. Perhaps the invitation to take free money will eclipse the question of want vs. need.”
A week went by, and one dollar disappeared. Afraid that the piece would dissolve too quickly, one lab member replaced the missing dollar. The art was whole again. More time went by, and another lab member needed change for the vending machine. So she took five singles and left her $5 bill. We treated the piece as if it was our own, moving bills around but preserving its integrity. The wall of money remained, for the most part, intact.
We asked Jody about her expectations for the piece.
“Among the scenarios I considered were one person swiping all of the dollars on the first day, the dollars slowly disappearing one-by-one, someone rearranging the dollars in a different design, or somewhat disappointingly, the piece remaining on the wall untouched.”
But the wall did not remain untouched, and one day it encountered a group of guests who came in on a particularly quiet day and left with most of the money. Sure, we were a little annoyed; our precious wall had been ransacked. But that was its purpose, and we laughed it off. At least we had a good story, right?
Some time later, one of the ransackers returned. This time, the CAH was bustling, full of people and lively conversation. He walked in, saw the commotion, and hesitated for just a moment before telling us that he was hungry. We don’t have any food here, but there are plenty of restaurants down the street, we told him. Of course, he was not asking where he could buy food. We knew that. But none of us jumped up to offer what was left of the money hanging on the wall. It was art, after all.
Here we were, hosting an exhibit on “inequality,” and there was no doubt that this man lay farther down on the distribution of wealth than any of us. And in all of our musings on the exhibit, never did we think that we might find ourselves faced with the perfect case of actual inequality.
Until this moment, we had primarily used and conceived of the wall of bills as a cashier. Yes, we contemplated whether we needed or simply wanted a dollar. But most of us don’t need a dollar. In the end, this experience may be the ultimate experiment of our project. And we stumbled into it unintentionally, or rather, he stumbled into our gallery.
A collaboration between Dan Ariely & Aline Grüneisen
The PoorQuality: Inequality Exhibit will be up until the end of August (and we will see whether there are any dollar bills left).PoorQuality: Inequality Opening Reception
innovative and engaging artwork.
social and economic inequality.
wealth distribution.
what is so taxing about taxation?
Opening Reception: June 22, 2012 from 6 – 10 PM at the CAH
Featuring drinks, classy appetizers, and the fabulous DJ Mike B
With no limitation to the style or media of pieces created for PoorQuality: Inequality, a portion of the artists, which included sculptors, painters, book artists, video artists, and photographers, branched out stylistically from their normal medium, while others pushed conceptual boundaries.
Some chose to explore how to visualize analytical data. Suzanne Broughel used color to interpret the U.S. racial wealth gap by decorating a white bed sheet “canvas” with coin marks made by dipping quarters and pennies in liquid foundation makeup and pressing them on the fabric. Peter Lisignoli, an MFA student at Duke University, became interested in how one represents the absence of food. He photographed a Quick-n-Go market to rethink how space and time are rendered by such a space. Despite his efforts to tackle the social issue of food inequality, his project changed focus toward the ghettoizing gaze of the surveillance camera.
Other artists explored the capacity for art to spark an emotional response to the research presented by the Center for Advanced Hindsight. Leslie Salzillo’s “The Rise of Soraya M (What Does that Make Her?)” honors all women who have suffered small and great injustices created by the unequal legal and social double standards misinterpreted to dehumanize women.
June 1, 2012 – August 31, 2012
Open to the public Monday – Friday 10 AM – 3 PM